As pandas’ documentation claims: pandas provides high-performance data structures. But how do we verify that the claim is correct? And how do we ensure that it stays correct over many releases. This post describes
- pandas’ current setup for monitoring performance
- My personal debugging strategy for understanding and fixing performance regressions when they occur.
I hope that the first section topic is useful for library maintainers and the second topic is generally useful for people writing performance-sensitive code.
Know thyself
The first rule of optimization is to measure first. It’s a common trap to think you know the performance of some code just from looking at it. The difficulty is compounded when you’re reviewing a diff in a pull request and you lack some important context. We use benchmarks to measure the performance of code.
There’s a strong analogy between using unit tests to verify the correctness of
code and using benchmarks to verify its performance. Each gives us some
confidence that an implementation behaves as expected and that refactors are not
introducing regressions (in correctness or performance). And just as you use can
use a test runner like unittest or pytest to organize and run unit tests,
you can use a tool to organize and run benchmarks.
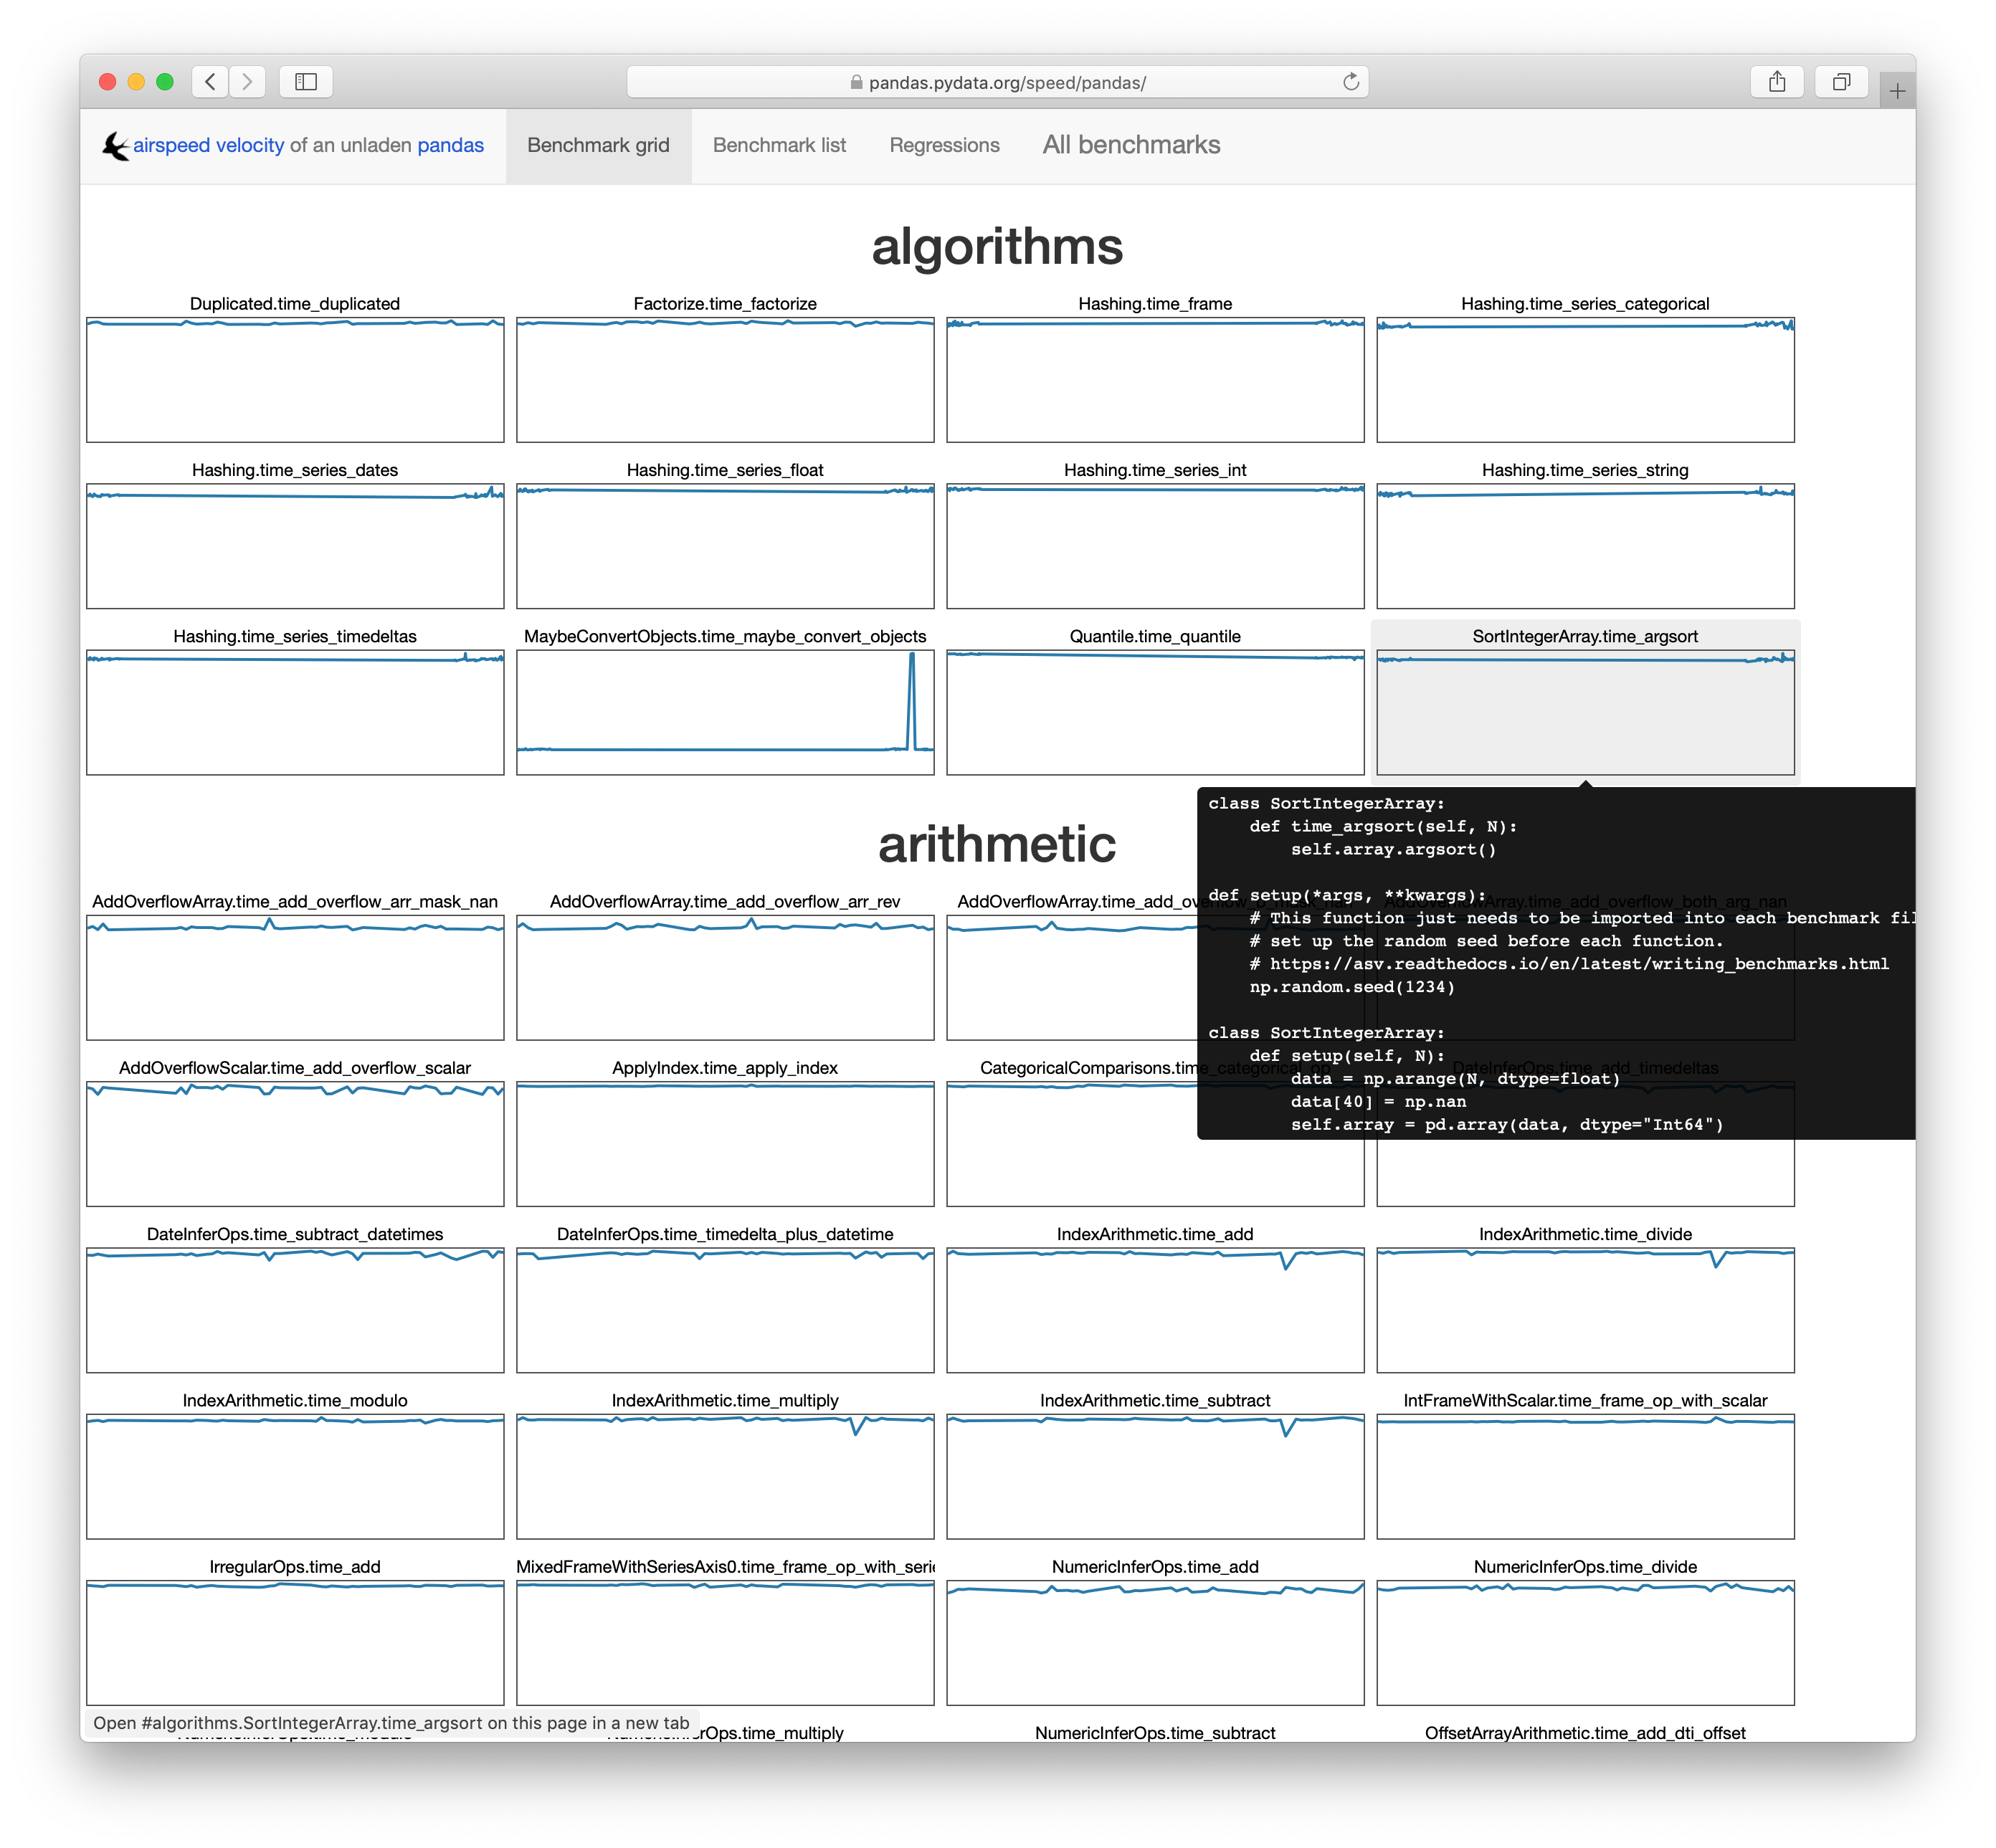
For that, pandas uses asv.
airspeed velocity (
asv) is a tool for benchmarking Python packages over their lifetime. Runtime, memory consumption and even custom-computed values may be tracked. The results are displayed in an interactive web frontend that requires only a basic static webserver to host.
asv provides a structured way to write benchmarks. For example, pandas Series.isin
benchmark looks roughly like
class IsIn:

    def setup(self):
        self.s = Series(np.random.randint(1, 10, 100000))
        self.values = [1, 2]

    def time_isin(self):
        self.s.isin(self.values)
There’s some setup, and then the benchmark method starting with time_. Using
the asv CLI, benchmarks can be run for a specific commit with
asv run <commit HASH>, or multiple commits can be compared with
asv continuous <GIT RANGE>. Finally, asv will collect performance over time
and can visualize the output. You can see pandas’ at
https://pandas.pydata.org/speed/pandas/.
Detecting Regressions
asv is designed to be run continuously over a project’s lifetime. In theory, a
pull request could be accompanied with an asv report demonstrating that the
changes don’t introduce a performance regression. There are a few issues
preventing pandas from doing that reliably however, which I’ll go into later.
Handling Regressions
Here’s a high-level overview of my debugging process when a performance regression is discovered (either by ASV detecting one or a user reporting a regression).
To make things concrete, we’ll walk through this recent pandas issue, where a slowdown was reported. User reports are often along the lines of
DataFrame.memory_usageis 100x slower in pandas 1.0 compared to 0.25
In this case, DataFrame.memory_usage was slower with object-dtypes and
deep=True.
v1.0.3: memory_usage(deep=True) took 26.4566secs

v0.24.0: memory_usage(deep=True) took 6.0479secs

v0.23.4: memory_usage(deep=True) took 0.4633secs
The first thing to verify is that it’s purely a performance regression, and not a behavior change or bugfix, by ensuring that the outputs match between versions. Sometimes correctness requires sacrificing speed. In this example, we confirmed that the outputs from 0.24 and 1.0.3 matched, so we focused there.
Now that we have what seems like a legitimate slowdown, I’ll reproduce it
locally. I’ll first activate environments for both the old and new versions (I
use conda for this, one environment per version
of pandas, but venv works as well assuming the error isn’t specific to a
version of Python). Then I ensure that I can reproduce the slowdown.
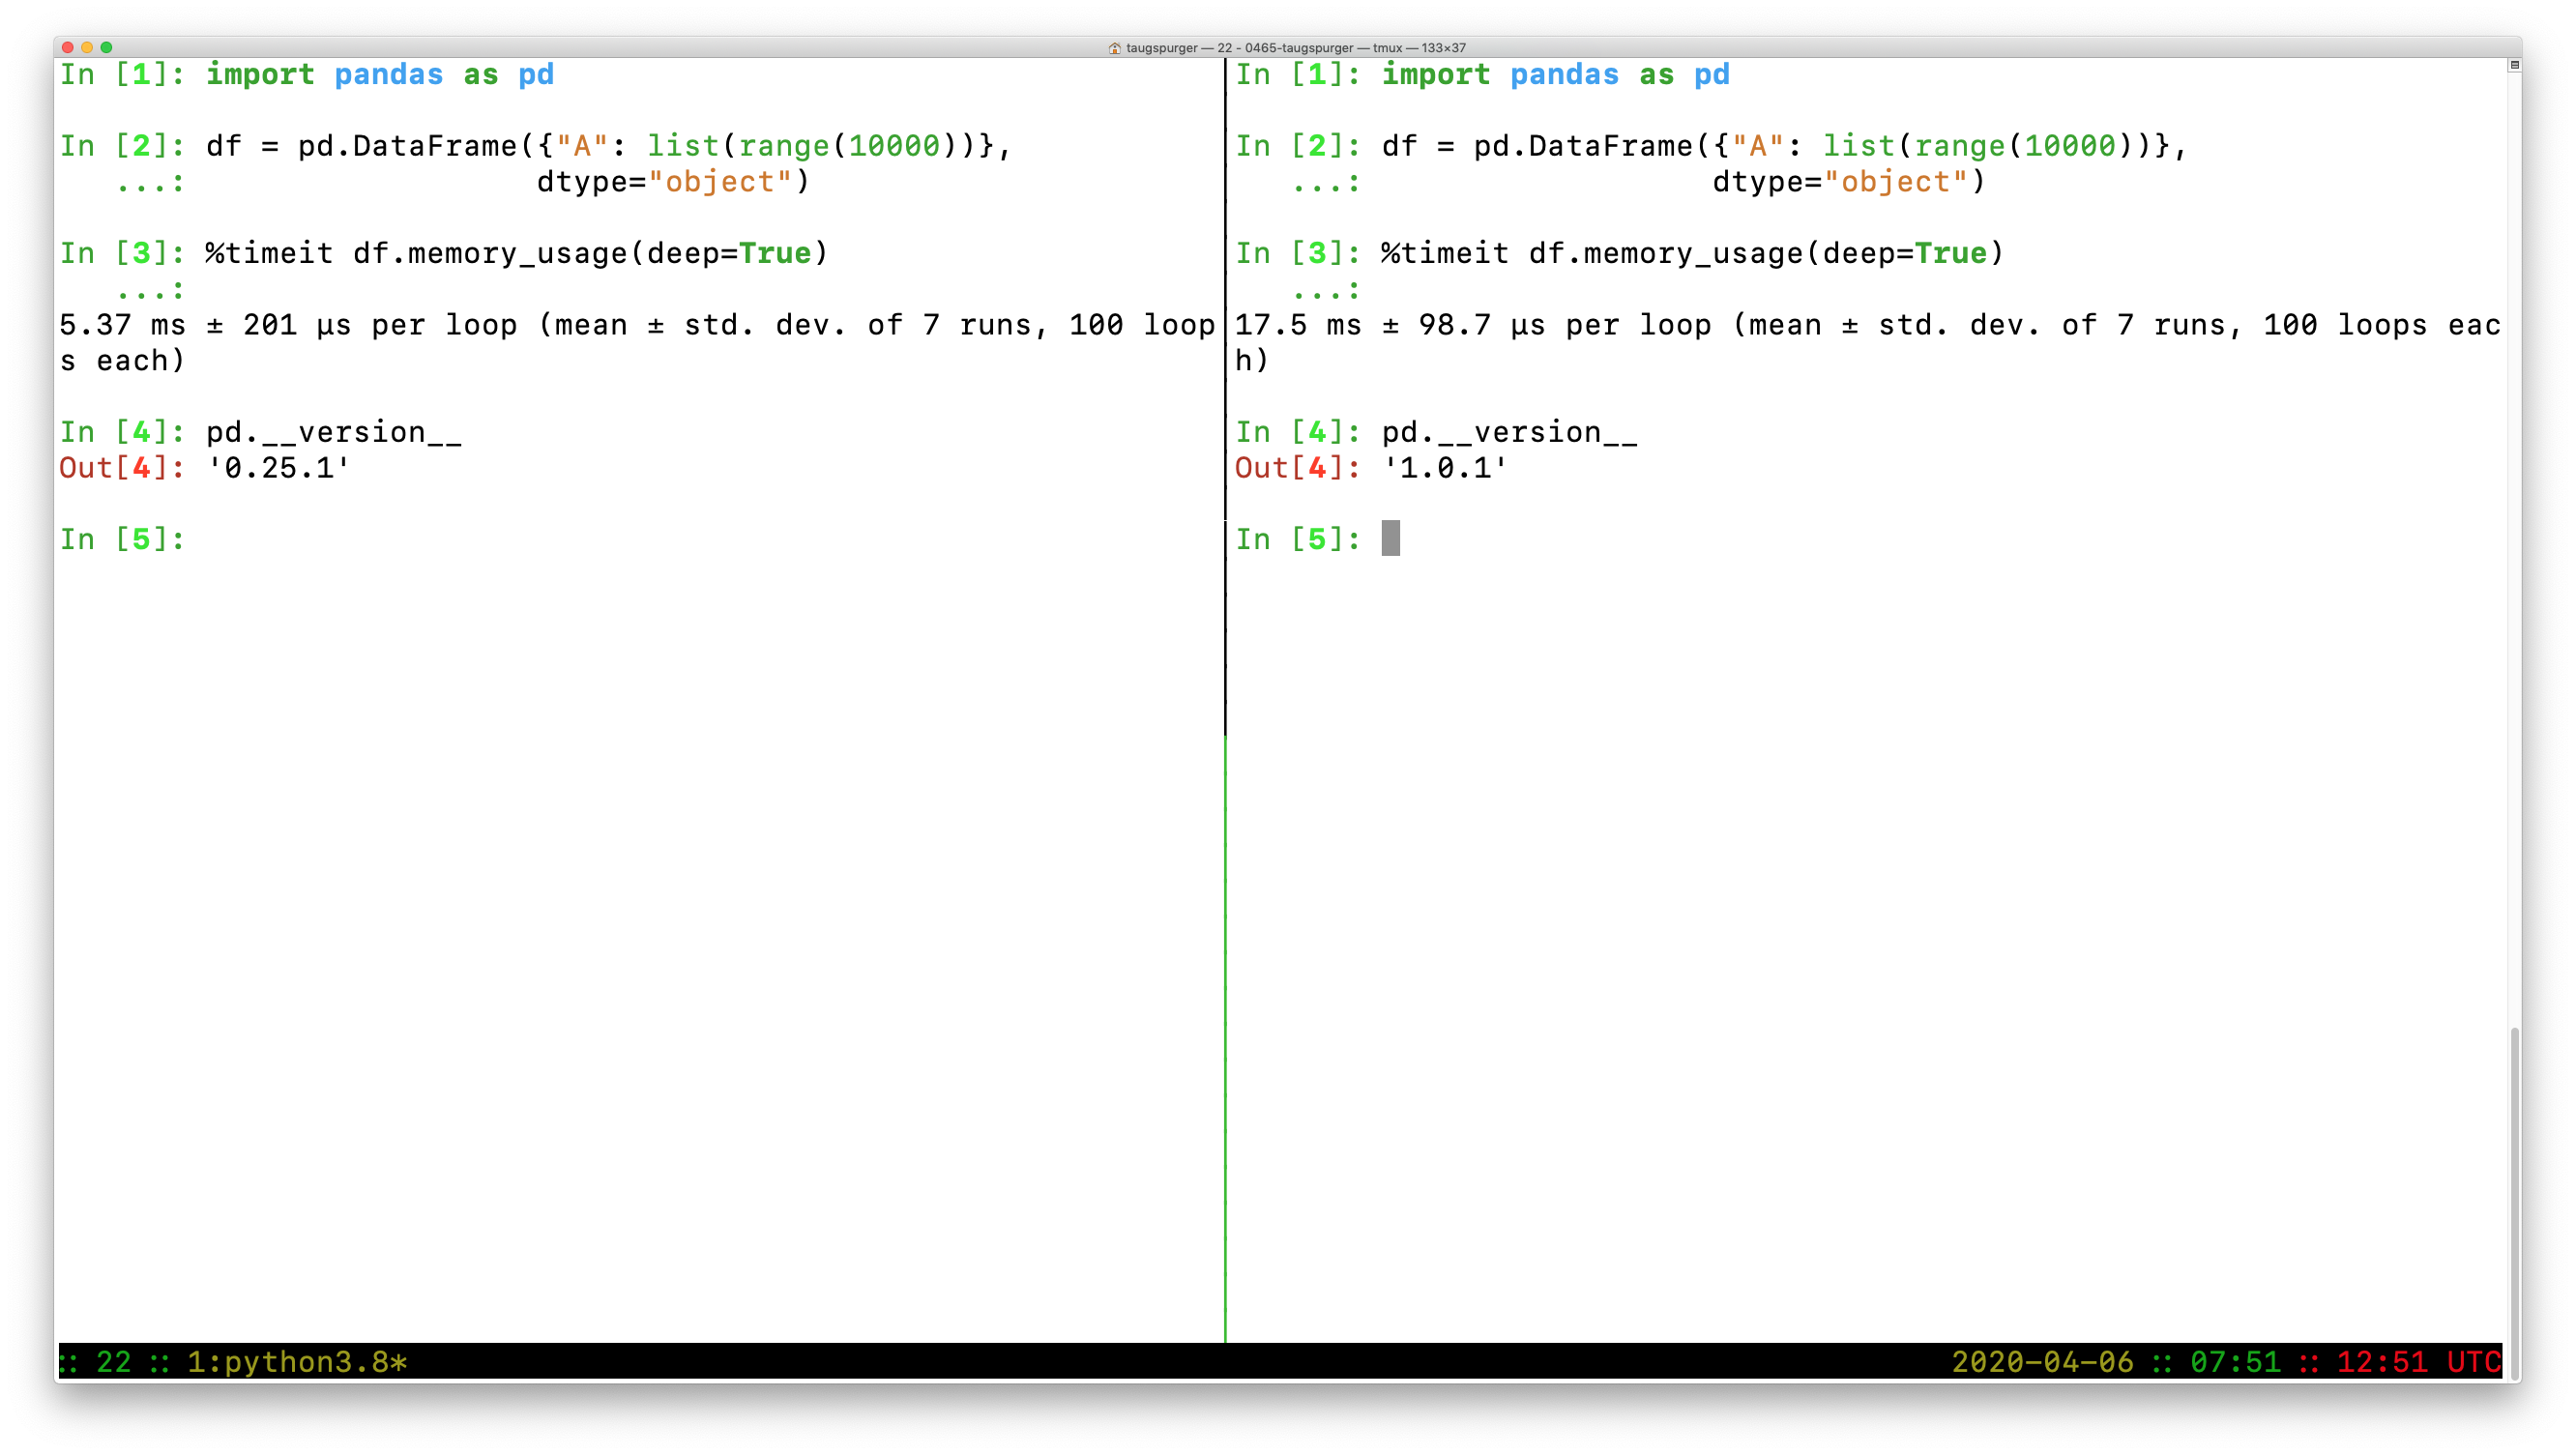
In [1]: import pandas as pd

In [2]: df = pd.DataFrame({"A": list(range(10000))}, dtype=object)

In [3]: %timeit df.memory_usage(deep=True)
5.37 ms ± 201 µs per loop (mean ± std. dev. of 7 runs, 100 loops each)

In [4]: pd.__version__
Out[4]: '0.25.1'
versus
In [1]: import pandas as pd

In [2]: df = pd.DataFrame({"A": list(range(10000))}, dtype=object)

In [3]: %timeit df.memory_usage(deep=True)
17.5 ms ± 98.7 µs per loop (mean ± std. dev. of 7 runs, 100 loops each)

In [4]: pd.__version__
Out[4]: '1.0.1'
So we do have a slowdown, from 5.37ms -> 17.5ms on this example.
Once I’ve verified that the outputs match and the slowdown is real, I turn to snakeviz (created by Matt Davis, which measures performance at the function-level. For large enough slowdowns, the issue will jump out immediately with snakeviz.
From the snakeviz docs, these charts show
the fraction of time spent in a function is represented by the extent of a visualization element, either the width of a rectangle or the angular extent of an arc.
I prefer the “sunburst” / angular extent style, but either works.
In this case, I noticed that ~95% of the time was being spent in
pandas._libs.lib.memory_usage_of_object, and most of that time was spent in
PandasArray.__getitem__ in pandas 1.0.3. This is where a bit of
pandas-specific knowledge comes in, but suffice to say, it looks fishy1.
As an aside, to create and share these snakeviz profiles, I ran the output of
the %snakeviz command through
svstatic and
uploaded that as a gist (using gist). I
then pasted the “raw” URL to https://rawgit.org/ to get the URL embedded here as
an iframe.
Line Profiling
With snakeviz, we’ve identified a function or two that’s slowing things down. If
I need more details on why that’s function is slow, I’ll use
line-profiler. In our example, we’ve
identified a couple of functions, IndexOpsMixin.memory_usage and
PandasArray.__getitem__ that could be inspected in detail.
You point line-profiler at one or more functions with -f and provide a
statement to execute. It will measure things about each line in the function,
including the number of times it’s hit and how long is spent on that line (per
hit and total)
In  [9]: %load_ext line_profiler
In [10]: %lprun -f pd.core.base.IndexOpsMixin.memory_usage df.memory_usage(deep=True)
Total time: 0.034319 s
File: /Users/taugspurger/miniconda3/envs/pandas=1.0.1/lib/python3.8/site-packages/pandas/core/base.py
Function: memory_usage at line 1340

Line #      Hits         Time  Per Hit   % Time  Line Contents
==============================================================
  1340                                               def memory_usage(self, deep=False):
  ...
  1363         1         56.0     56.0      0.2          if hasattr(self.array, "memory_usage"):
  1364                                                       return self.array.memory_usage(deep=deep)
  1365
  1366         1         11.0     11.0      0.0          v = self.array.nbytes
  1367         1         18.0     18.0      0.1          if deep and is_object_dtype(self) and not PYPY:
  1368         1      34233.0  34233.0     99.7              v += lib.memory_usage_of_objects(self.array)
  1369         1          1.0      1.0      0.0          return v
THe % time column clearly points to lib.memory_usage_of_objects. This is a
Cython function, so we can’t use line-profiler on it. But we know from the
snakeviz output above that we eventually get to PandasArray.__getitem__
In [11]: %lprun -f pd.arrays.PandasArray.__getitem__ df.memory_usage(deep=True)
Timer unit: 1e-06 s

Total time: 0.041508 s
File: /Users/taugspurger/miniconda3/envs/pandas=1.0.1/lib/python3.8/site-packages/pandas/core/arrays/numpy_.py
Function: __getitem__ at line 232

Line #      Hits         Time  Per Hit   % Time  Line Contents
==============================================================
   232                                               def __getitem__(self, item):
   233     10000       4246.0      0.4     10.2          if isinstance(item, type(self)):
   234                                                       item = item._ndarray
   235
   236     10000      25475.0      2.5     61.4          item = check_array_indexer(self, item)
   237
   238     10000       4394.0      0.4     10.6          result = self._ndarray[item]
   239     10000       4386.0      0.4     10.6          if not lib.is_scalar(item):
   240                                                       result = type(self)(result)
   241     10000       3007.0      0.3      7.2          return result
In this particular example, the most notable thing is that fact that we’re
calling this function 10,000 times, which amounts to once per item on our 10,000
row DataFrame. Again, the details of this specific example and the fix aren’t
too important, but the solution was to just stop doing that2.
The fix was provided by
@neilkg soon after the issue was identified, and
crucially included a new asv benchmark for memory_usage with object dtypes.
Hopefully we won’t regress on this again in the future.
Workflow issues
This setup is certainly better than nothing. But there are a few notable problems, some general and some specific to pandas:
Writing benchmarks is hard work (just like tests). There’s the general issue of writing and maintaining code. And on top of that, writing a good ASV benchmark requires some knowledge specific to ASV. And again, just like tests, your benchmarks can be trusted only as far as their coverage. For a large codebase like pandas you’ll need a decently large benchmark suite.
But that large benchmark suite comes with it’s own costs. Currently pandas’ full suite takes about 2 hours to run. This rules out running the benchmarks on most public CI providers. And even if we could finish it in time, we couldn’t really trust the results. These benchmarks, at least as written, really do need dedicated hardware to be stable over time. Pandas has a machine in my basement, but maintaining that has been a time-consuming, challenging process.
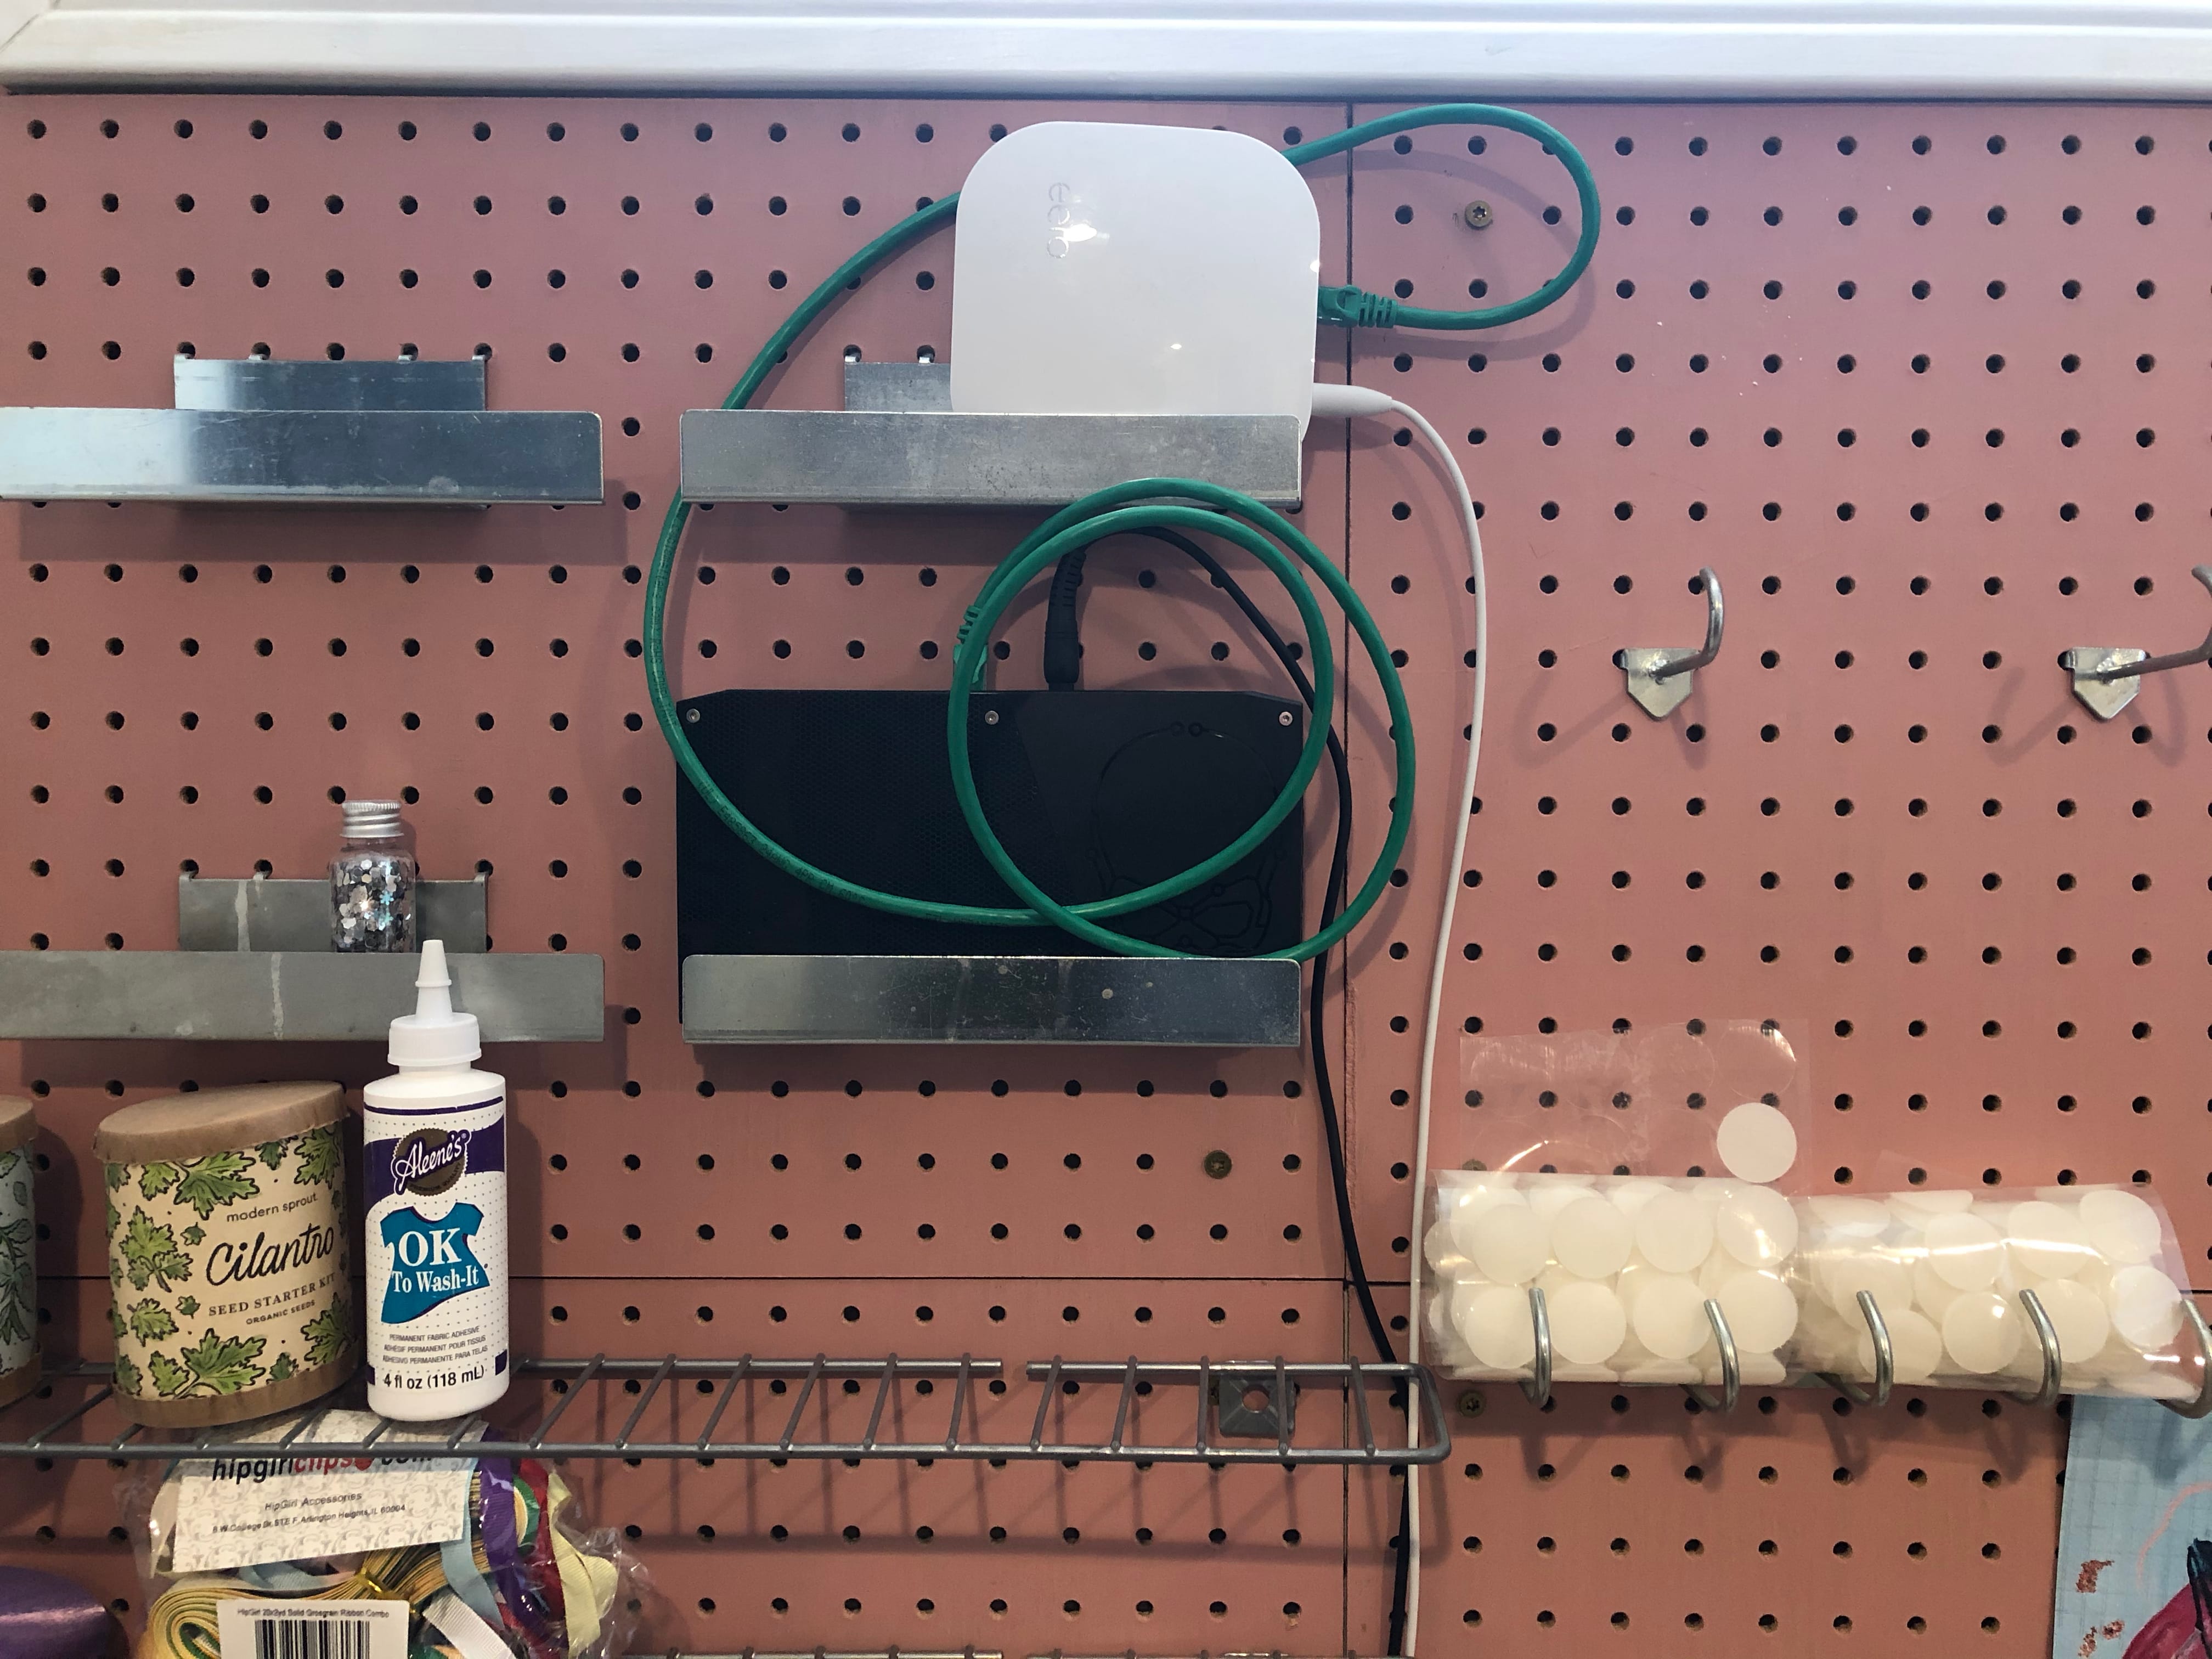
This is my current setup, which stuffs the benchmark server (the black Intel NUC) and a router next to my wife’s art storage. We reached this solution after my 2 year old unplugged the old setup (on my office floor) one too many times. Apologies for the poor cabling.
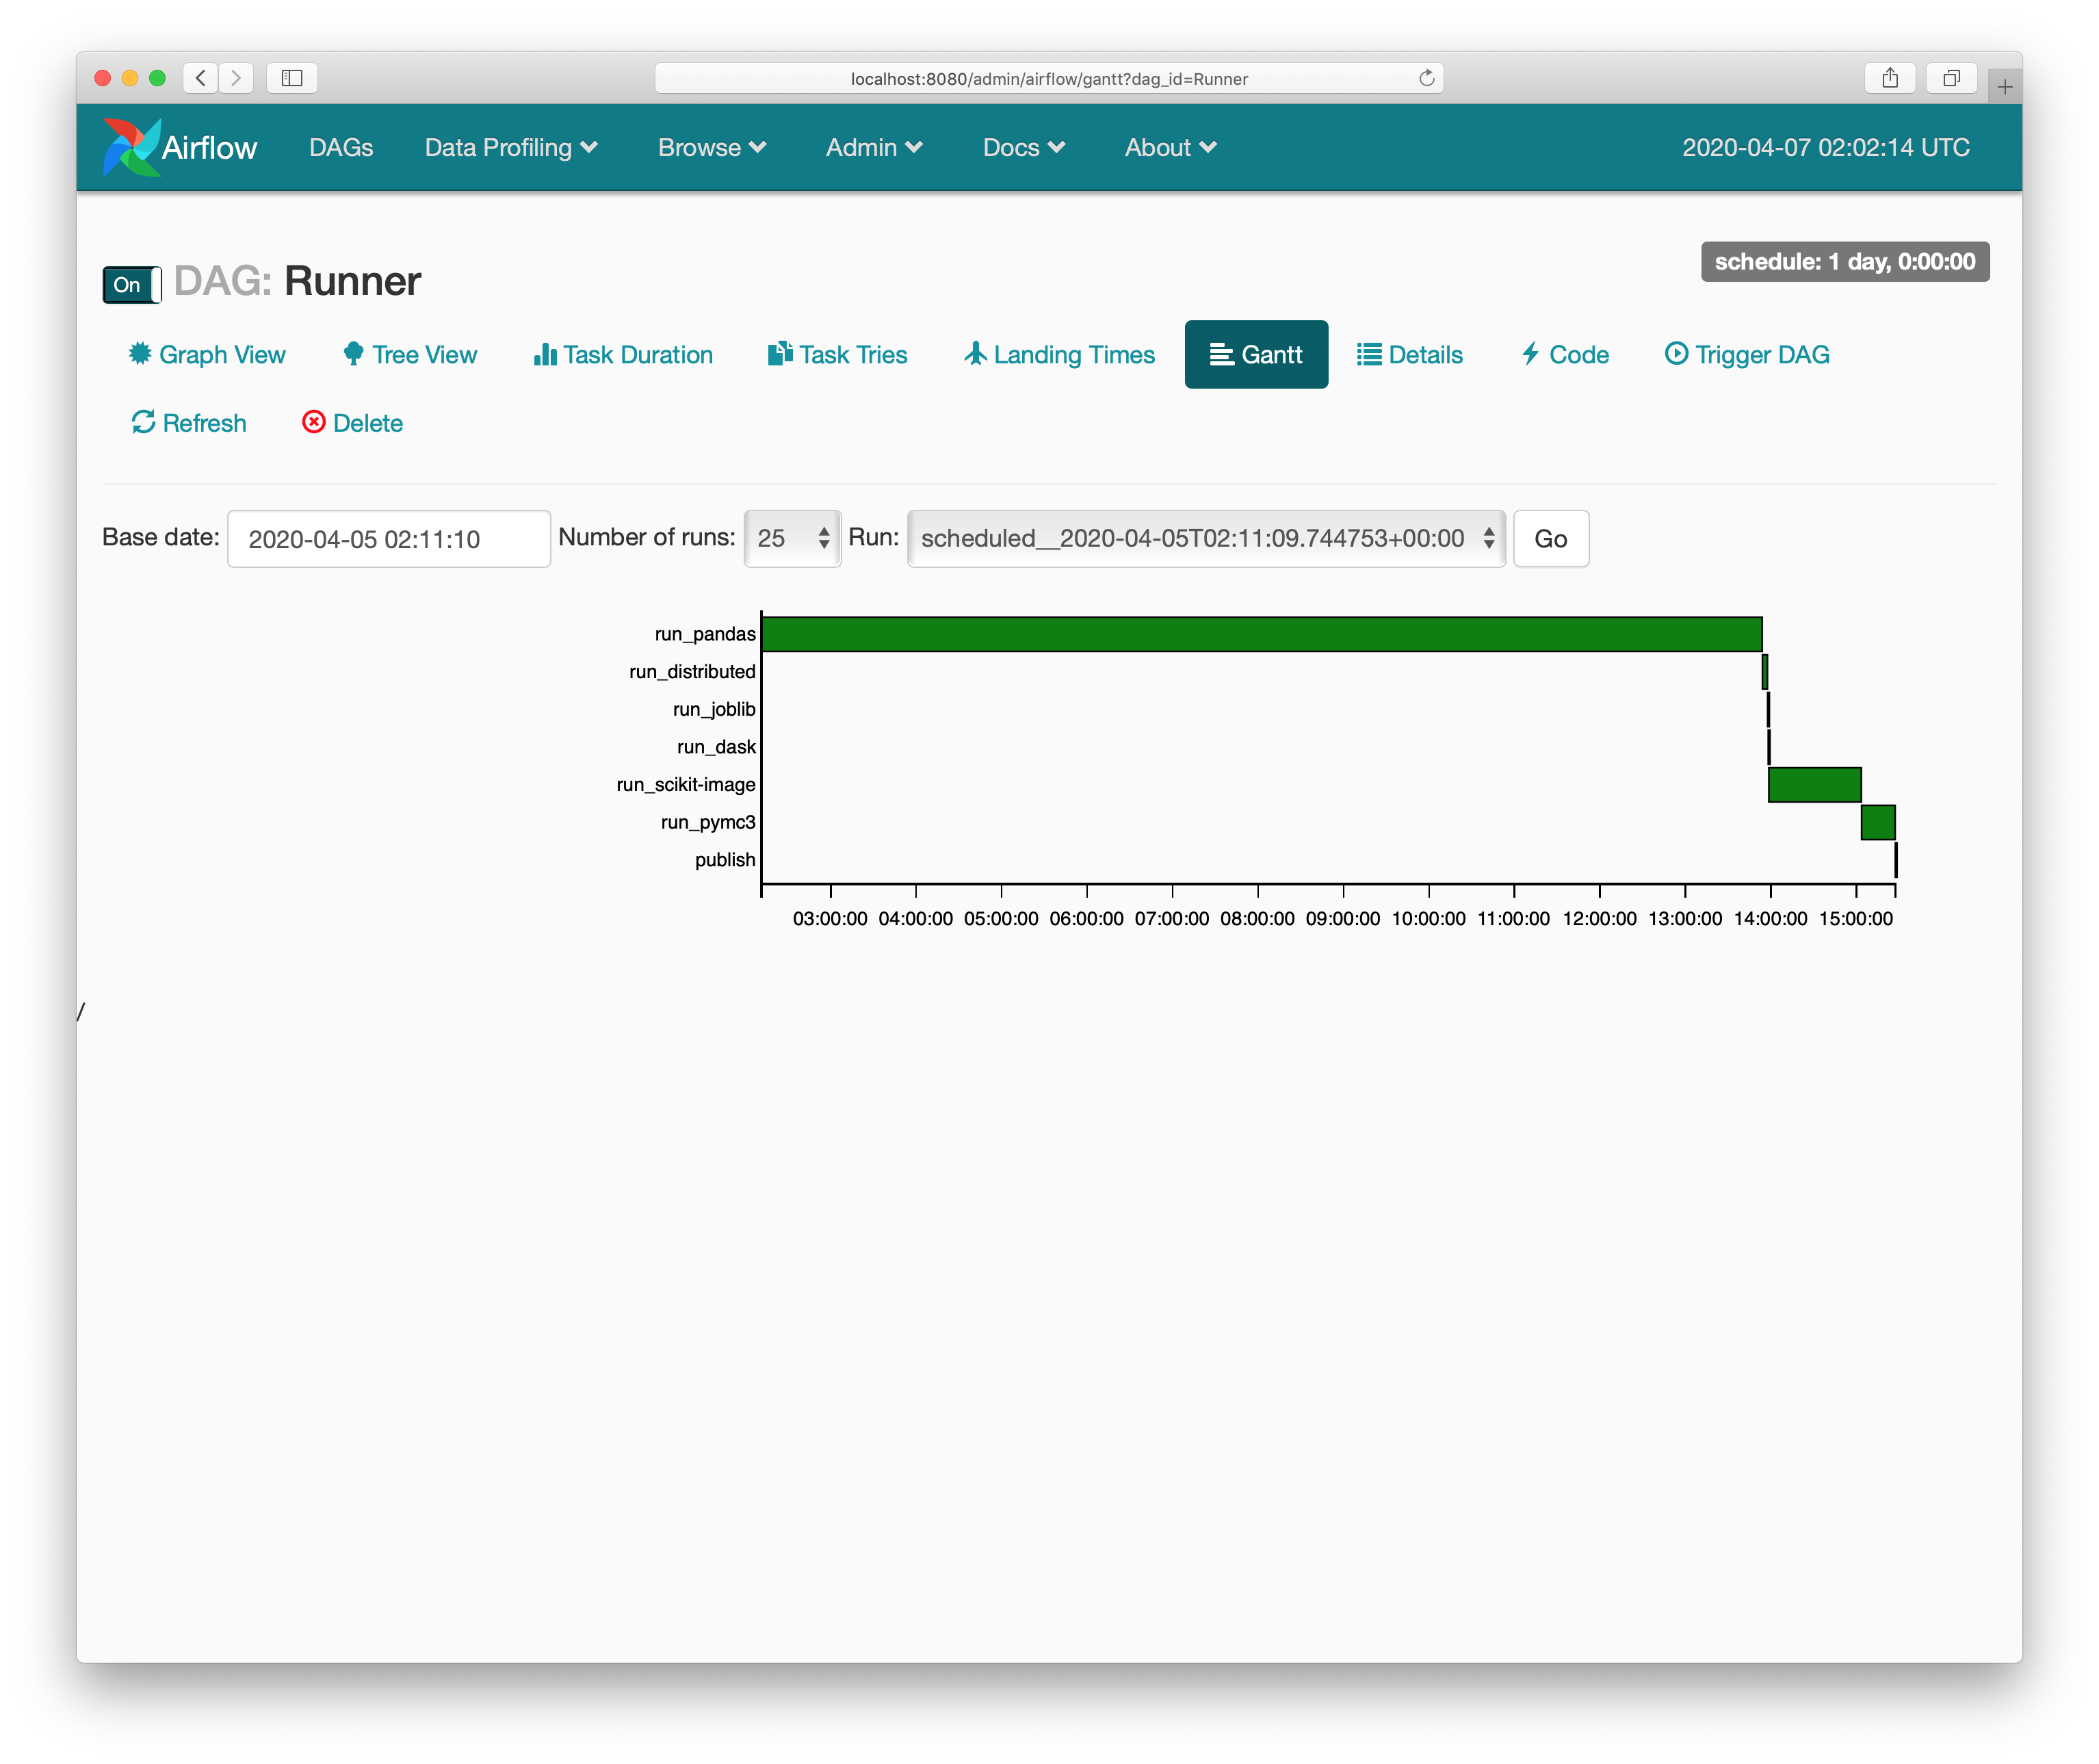
We deploy the benchmarks (for pandas
and a few other NumFOCUS projects) using Ansible. The scripts get the benchmarks
in place, Airflow to run them nightly, and supervisord to kick everything off.
The outputs are rsynced over to the pandas webserver and served at
https://pandas.pydata.org/speed/. You can
see pandas’ at
https://pandas.pydata.org/speed/pandas/.
If this seems like a house of cards waiting to tumble, that’s because it is.
Pandas has applied for a NumFOCUS small development grant to improve our
benchmark process. Ideally maintainers would be able to ask a bot @asv-bot run -b memory_usage which would kick off a process that pulled down the pull
request and ran the requested benchmarks on a dedicated machine (that isn’t
easily accessible by my children).
Recap
To summarize:
- We need benchmarks to monitor performance, especially over time
- We use tools like
asvto organize and benchmark continuously - When regressions occur, we use
snakevizandline-profilerto diagnose the problem
PandasArray is a very simple wrapper that implements pandas' ExtensionArray interface for 1d NumPy ndarrays, so it’s essentially just an ndarray. But, crucially, it’s a Python class so it’s getitem is relatively slow compared to numpy.ndarray’s getitem. ↩︎
It still does an elementwise getitem, but NumPy’s
__getitem__is much faster thanPandasArray’s. ↩︎